Posted on
January 24, 2017
by
Marie Taverna
Forty per cent of real estate advisors believe that American inquiries will continue to climb after Donald Trump assumes power
Canada’s reputation surges in international rankings
January 2017 – According to data released today by Royal LePage, Canada’s leading real estate services provider, American interest in Canadian real property has risen following the U.S. Presidential Election, with an increased number of Americans conducting research into real estate markets across the nation.
American web traffic on royallepage.ca, the company’s consumer real estate portal, has been hig
hly correlated to recent U.S. political events. U.S.-originated sessions surged 329.0 per cent the day following the election and climbed 210.1 per cent year-over-year the week after Donald Trump’s victory. Looking at the full month of November, 2016, U.S. web traffic grew 73.7 per cent year-over-year, when compared to the same period in 2015. This trend continued throughout the remainder of 2016, with American web traffic rising by 40.9 per cent year-over-year during the fourth quarter[1].
According to a new Canada-wide survey of 1,226 Royal LePage real estate advisors, U.S. interest in Canadian real property will continue to climb, with 39.5 per cent of respondents forecasting that American inquiries into Canadian real estate will rise under President Donald Trump. In the fourth quarter of 2016 – of which November and December are traditionally quieter times for North American real estate activity – 15.6 per cent of the advisors polled received inquiries from south of the border.
“Always a desirable destination for migrants, Canada’s attractiveness as a country for international relocation has surged this decade,” said Phil Soper, president and chief executive officer, Royal LePage. “The United States was already a top source for immigration into Canada, and now in the period following the recent U.S. election, we are witnessing a material bump in American interest in Canadian real estate.”
During the fourth quarter of 2016, American interest was primarily focused on Canada’s largest markets, with Ontario, British Columbia and Quebec receiving 72.7 per cent of all U.S. regional page views generated on royallepage.ca. Those looking to purchase Canadian real property were largely interested in the country’s residential market, with three quarters (75.2 per cent) of all American inquiries pertaining to this market segment.
“U.S. interest in Canadian real estate is not a new phenomenon –– we are next door neighbours,” said Soper. “From Whistler to Muskoka; to Tremblant and Nova Scotia’s south shore, Americans have traditionally been the largest foreign cohort of recreational property purchasers in Canada. With our country’s ever-growing global reputation as a financially sound, happy and culturally tolerant place to raise a family, it is not surprising that interest has moved from a place to play, to a potential place to live and work.”
“Given America’s vast population, even a fractional increase in the number of households following through on this initial interest and successfully completing the demanding process of emigrating to Canada could drive a material increase in the number of home-buyers from south of the border,” concluded Soper. “Our federal government is seriously considering increasing the quota of new Canadians welcomed from abroad, and with the high value of the U.S. dollar increasing Americans’ purchasing power, we may be seeing more moving trucks with U.S. license plates in our future.”
In last year’s inaugural “Best Countries” ranking published by US News in partnership with BAV and the Wharton School, Canada was ranked second worldwide in the comprehensive 75 element study, scoring very high on culture, sustainability, entrepreneurship and open-for-business categories. In the United Nations’ “Global Happiness Ranking,” Canadians scored sixth place. Additionally, the Economist’s widely followed “Most Liveable Cities” analysis, which ranks cities based on a balance of economic, safety and environmental factors, placed Vancouver, Toronto and Calgary in three of the top five spots worldwide, with no U.S. city ranked in the top ten.
Provincial Summaries and Trends
Ontario led the country as the top-researched destination by Americans on royallepage.ca in the fourth quarter of 2016, with 41.4 per cent of U.S. regional page views directed to the province. Over the same period, Ontario listings received a significant boost in U.S. page views, rising 54.5 per cent this year over last. According to the survey, 62.5 per cent of real estate advisors polled in Ontario cited the Greater Toronto Area (GTA) as the most desirable location for U.S. parties making inquiries into a home purchase since October 2016, while just over two-thirds (67.2 per cent) pointed to the GTA as the region in which Americans purchased the most property over the same period of time. Looking ahead, 38.4 per cent of survey respondents from Ontario expect U.S. inquiries into Canadian real estate to increase following Donald Trump’s assumption of power.
In the fourth quarter of 2016, British Columbia accounted for 17.4 per cent of U.S. regional page views, while also showing a 62.9 per cent increase year-over-year. Interestingly, according to the survey, Victoria garnered the most attention among B.C. cities from prospective U.S. home-buyers, being cited as the preferred location by approximately one third (32.1 per cent) of respondents. In comparison, one quarter (25.0 per cent) of respondents cited Greater Vancouver as the top region of interest among American home-buyers considering a real estate purchase in B.C. Looking ahead to 2017, 43.6 per cent of B.C. respondents anticipate American inquiries into Canadian real estate will increase after Donald Trump takes office.
U.S. traffic to Royal LePage’s Quebec listings accounted for 13.9 per cent of the total website sessions logged across provinces in the fourth quarter of 2016, and showed a 17.6 per cent increase in U.S. page views, year-over-year. Meanwhile, the survey found that 40.0 per cent of Quebec respondents named the Greater Montreal Area as the main market in Quebec that Americans considered for a potential property purchase. In looking at property acquisitions by Americans since October 2016, of those polled in Quebec, over one half (53.3 per cent) of real estate advisors who sold a home to an American did so in the Greater Montreal Area, while 20.0 per cent sold a home in each of Quebec City and Mont-Tremblant. When Donald Trump takes office, 52.2 per cent of Quebec respondents believe the region will see an increase in U.S. inquiries in the period that follows.
Despite accounting for a smaller percentage of U.S. website traffic provincially (7.4 per cent in Nova Scotia; 5.7 per cent in New Brunswick; 2.3 per cent in Prince Edward Island; and 2.1 per cent in Newfoundland and Labrador), according to real estate advisors surveyed, Atlantic Canada saw the highest percentage of sales inquiries from Americans since October 2016. In fact, during the fourth quarter, Royal LePage’s data showed a year-over-year increase in U.S. website sessions of 180.4 per cent, 125.5. per cent, 53.4 per cent and 41.7 per cent for New Brunswick, Nova Scotia, Prince Edward Island and Newfoundland and Labrador, respectively. Over one quarter (27.9 per cent) of survey respondents indicated that Americans have expressed interest in a property in the Atlantic region since October 2016, with a large majority of inquiries (54.8 per cent) and purchases (54.2 per cent) taking place in Halifax. Furthermore, almost half (48.1 per cent) of those surveyed in the region expect inquiries to increase after Donald Trump assumes power.
Provinces affected by recent economic downturns saw minimal interest from American buyers, with U.S website sessions for Alberta accounting for only 7.6 per cent of the total. The survey showed that, of those interested in Alberta, Calgary (54.6 per cent) and Edmonton (27.3 per cent) were cited by respondents as receiving the most interest from potential U.S. buyers. Notably, all (100 per cent) survey respondents working in the region indicated that they have not sold a home to an American since October 2016 – the only region in the country to report zero U.S. real estate transactions for this period. Similarly, only 26.4 per cent of respondents believe the region will see an increase in real estate inquiries by Americans after Donald Trump takes office.
The other provinces in the Prairies saw the least amount of interest by prospective American homeowners since October 2016, with only 1.6 per cent of U.S. website sessions being associated with Manitoba and 0.5 per cent with Saskatchewan. According to survey respondents, of the U.S. buyers interested in these provinces, Americans mostly inquired about property purchases in Winnipeg (50.0 per cent), Saskatoon (20.0 per cent) and rural Saskatchewan (15.0 per cent). Looking ahead, one third (33.3 per cent) of respondents expect to see an increase in American inquires after Trump assumes power.
Posted on
December 3, 2016
by
Marie Taverna
Home sales and listings just below 10-year average
Home buyer and seller activity remains near historical averages in the Metro Vancouver housing market.
Residential home sales in the region totalled 2,214 in November 2016, a decrease of 0.9 per cent from the 2,233 sales recorded in October 2016 and a decrease of 37.2 per cent compared to November 2015 when 3,524 homes sold.
Last month’s sales were 7.6 per cent below the 10-year sales average for the month.
“While 2016 has been anything but a normal year for the Metro Vancouver housing market, supply and demand totals have returned to more historically normal levels over the last few months,” said Dan Morrison, Real Estate Board of Greater Vancouver (REBGV) president.
New listings for detached, attached and apartment properties in Metro Vancouver totalled 3,147 in November 2016. This represents a decrease of 20.9 per cent compared to the 3,981 units listed in October 2016 and a 7.2 per cent decrease compared to November 2015 when 3,392 properties were listed.
Last month’s new listing count was 1.2 per cent below the region’s 10-year new listing average for the month.
The total number of properties currently listed for sale on the MLS® system in Metro Vancouver is 8,385, an 8.3 per cent decrease compared to October 2016 (9,143) and a 3.6 per cent increase compared to November 2015 (8,096).
The sales-to-active listings ratio for November 2016 is 26.4 per cent. This is up two per cent from last month (24.4 per cent).
Downward pressure on home prices can occur when the ratio dips below the 12 per cent mark for a sustained period, while home prices can experience upward pressure when it surpasses 20 per cent over several months.
“Demand, relative to supply, for detached homes is lower right now than demand for townhomes and apartments,” Morrison said. “This is causing prices to remain stable, or flat, for townhomes and apartments, while detached homes are seeing modest month-over-moth declines.”
The MLS® Home Price Index composite benchmark price for all residential properties in Metro Vancouver is currently $908,300. This represents a 1.2 per cent decrease compared to last month and a 20.5 per cent increase compared to November 2015.
Sales of detached properties in November 2016 reached 638, a decrease of 2.1 per cent from the 652 detached sales recorded in October 2016 and a 52.2 per cent decline over November 2015. The benchmark price for detached properties is $1,511,100. This represents a 2.2 per cent decline compared to last month and a 23 per cent increase compared to November 2015.
Sales of apartment properties reached 1,200 in November 2016, an increase of 1.9 per cent compared to the 1,178 sales in October 2016 and a 22.7 per cent decrease compared to November 2015.The benchmark price of an apartment property is $512,100. This is unchanged from last month and is an 18 per cent increase compared to November 2015.
Attached property sales in November 2016 totalled 376, a decrease of 6.7 per cent compared to the 403 sales in October 2016 and a 40.9 per cent decline compared to November 2015. The benchmark price of an attached unit is $667,100. This represents a 0.3 per cent decrease compared to last month and a 23 per cent increase compared to November 2015.
Posted on
July 13, 2016
by
Marie Taverna
BCREA ECONOMICS NOW
Bank of Canada Interest Rate Announcement - July 13, 2016
The Bank of Canada announced this morning that it is holding its target for the overnight interest rate at 0.5 per cent. In the press release accompanying the decision, the Bank noted that inflation is on track to return to its target of 2 per cent by 2017, though heightened global uncertainty presents a risk to that forecast. The Bank judges the overall risks to its forecast as roughly balanced, but noted financial vulnerabilities are elevated in the greater Vancouver and Toronto areas due to rising home prices.
Economic growth in Canada appears to be slowing as expected in the second quarter. Our tracking estimate of second quarter real GDP growth is currently at -0.5 per cent following a strong start to the year. Most of the slowdown is due to disruptions caused by the Alberta wildfires which points to a strong rebound as oil production comes back on-line and the reconstruction effort begins. That rebound will be further supported by a boost of fiscal stimulus planned for the second half of the year. An improved outlook for growth and firm but low trend inflation probably rule out any further rate cuts from the Bank, particularly given that long-term interest rates have already fallen to near record lows in recent weeks. Our forecast remains that the Bank will be sidelined for the remainder of 2016 and through most if not all of 2017.
“Copyright British Columbia Real Estate Association. Reprinted with permission.”
Posted on
July 13, 2016
by
Marie Taverna
Canada’s residential real estate market posts strongest growth in five years in the second quarter of 2016
Central bankers expected to keep interest rates lower for longer in light of Brexit and global uncertainty
TORONTO, July 13, 2016 – Canada’s residential real estate market continued to show strong appreciation in the second quarter of 2016, posting the highest national year-over-year gain seen in five years, according to the Royal LePage House Price Survey[1] and Market Survey Forecast released today. Amid continued world economic uncertainty, the historically low interest rate environment that has fueled Canada’s real estate market growth in recent years – most notably in Greater Vancouver and the Greater Toronto Area (GTA) – is expected to continue longer than anticipated. This extended period of low-cost borrowing will in turn further delay the cyclical cooling of Canada’s hottest real estate markets, originally forecasted for the second half of 2016.
The Royal LePage National House Price Composite, compiled from proprietary property data in 53 of the nation’s largest real estate markets, shows that the price[2]of a home in Canada increased 9.2 per cent year-over-year to $520,223 in the second quarter of 2016. During the same period, the price of a two-storey home rose 10.7 per cent year-over-year to $619,671, the price of a bungalow increased 7.9 per cent to $437,121, and the price of a condominium increased 4.2 per cent to $348,189. Looking ahead to the remainder of 2016, Royal LePage forecasts that the aggregate price of a home in Canada will increase 12.4 per cent when compared to year end 2015.
“Our forecasting models, which pointed to a slowing housing market as the year progressed, included a modest increase in the cost of borrowing,” said Phil Soper, president and chief executive officer, Royal LePage. “Economic and social disruptions have rocked the world once again, introducing new risks and making it very likely that the Bank of Canada will leave interest rates as-is for now. Few industries are as rate sensitive as real estate. We don’t see even a mild correction for either the Toronto or pistol-hot Vancouver markets in 2016.”
“Our call for 12.4 per cent national price appreciation in the final quarter of this calendar year as compared to the final quarter of last year, is a landmark in Canada. I believe it is the highest value put forward by any serious forecasting agency since the turn of the century,” added Soper.
On June 23, 2016, Britons voted to leave the European Union, surprising financial markets worldwide. The British currency plummeted and the value of equities around the world swung wildly. Adding to economic uncertainty is an uncharted road ahead for decoupling the U.K. from the E.U., a process which some have predicted could take two years. This added dimension of uncertainty will encourage central bankers in Canada and abroad to keep rates lower for longer.
“Some have suggested that Britain’s exit from the E.U. will drive more foreign money into the relative safety of Canada’s real estate markets,” said Soper. “We anticipate the impact, if any, will be seen in the commercial property sector and not in housing markets. Beyond Europe, our research does point to increasing Vancouver and Toronto region foreign buyer[3] activity in residential markets this quarter. Canada remains a favoured nation for the world’s real estate investors.”
According to a survey[4] of Royal LePage real estate advisors working within these regions, 71 and 74 per cent said that year-over-year home purchases by international buyers have increased in the second quarter in the GTA and Greater Vancouver, respectively. Still, 35 and 37 per cent of respondents believe that foreign ownership accounts for less than 10 per cent of the GTA and Greater Vancouver housing markets, respectively.
“At Royal LePage, we see residential real estate as a long-term investment supporting family life. A home is ill-suited as a buy-and-flip investment. People that engage in this kind of activity are inevitably burned when a market slows and the time it takes to sell the property increases substantially. We applaud the efforts of all levels of government to better understand Canada’s housing market, through a coordinated effort to gather and analyze real estate data. Still, we remain convinced that heavy-handed use of tax policy in an effort to artificially influence asset values in an open-market economy like ours is fraught with peril, particularly in a cyclical industry like housing,” concluded Soper.
Provincial and City Summaries & Trends
Since the 2014 collapse of oil prices and the subsequent drop in the value of the Canadian dollar, the nation’s economy has been dominated by growth in British Columbia, Ontario, Manitoba and Quebec – the four provinces most tied to the finished goods and services export sector, and by extension, to the health of the U.S. economy. The negative impact of the downturn in the resource sector, in contrast, remains concentrated in Alberta, Saskatchewan, New Brunswick and Newfoundland and Labrador. Across the country, provincial economic trends can be seen influencing residential real estate market performance in most cities.
British Columbia’s economy has outperformed the balance of the country for two years running and is expected to continue doing so into 2017. This economic strength is echoed in the province’s housing market. In the second quarter, Greater Vancouver posted an aggregate year-over-year home price increase of 24.6 per cent to a median price of $1,098,599. During the same period, the city of Vancouver posted a year-over-year gain of 27.5 per cent to $1,330,531, while surrounding areas such as West Vancouver and Richmond posted even higher increases of 29.7 per cent and 28.3 per cent to median prices of $3,093,776 and $972,443, respectively.
Manitoba has been cited as one of the provinces that will outpace the national economy in 2016 and 2017[5]. This is attributed mainly to its strength in a diverse set of industries such as agriculture, health sciences, transportation, manufacturing and business services, rounding off the edges of some of the would-be effects of the commodities downturn. In Winnipeg, the aggregate price of a home increased by a moderate 2.0 per cent in the second quarter to a median price of $285,358, with the detached two-storey home category posting the highest year-over-year price gain of 3.7 per cent to $314,589.
Ontario is expected to be one of the fastest growing provinces in 2016, with employment growth running at twice the national average so far this year. Very strong U.S. employment growth in June should once again stimulate Ontario’s export sector, after a tepid performance in the second quarter, as more American businesses look to Canada for affordable goods and services. The GTA, the province’s largest market, saw notable year-over-year home price appreciation of 10.2 per cent to a median price of $656,365, while home price appreciation in the city of Toronto remained in-line with recent quarters, rising 8.4 per cent to $680,096. Surrounding suburbs such as Richmond Hill, Whitby and Oshawa continued to outpace home price appreciation in the core, posting year-over-year aggregate home price gains of 21.3 per cent, 17.1 per cent and 16.7 per cent, to $992,632, $547,304 and $409,452, respectively. Meanwhile, in the nation’s capital home prices remained steady in the second quarter, with the aggregate price of a home in Ottawa increasing 2.3 per cent to a median price of $401,288.
Strength in exports to the U.S. is expected to continue to support provincial growth in the remainder of the year in Quebec. Last month Fitch Ratings revised its outlook for the province from “negative” to “stable”, citing Quebec’s diverse economy as a key strength. An increase in full-time jobs and renewed stability and confidence in Quebec’s economy is being reflected in the province’s residential housing sector, particularly in the Montreal region. In the second quarter, the aggregate price of a home in the Greater Montreal Area increased by a healthy 3.5 per cent year-over-year to $344,620, while the aggregate price of a home in Montreal Centre rose 4.9 per cent to a median price of $416,953. This is indicative of a transition in the region, which is currently seeing a trend toward a seller’s market in the two-storey home segment, and a balanced market for other property types.
The Conference Board of Canada has projected that Alberta’s economy will dip 2.0 per cent this year as a result of the sharp pullback in drilling and capital investment in the energy sector, along with the impact of the Fort McMurray fires. Despite economic setbacks, residential real estate prices in the region have not seen the depreciation many onlookers had expected. In the second quarter, the aggregate price of a home in Calgary decreased 1.8 per cent year-over-year to $454,790, while the aggregate home price in Edmonton dipped 1.2 per cent to $377,337.
Like Alberta, Saskatchewan is being hit by weakness in the energy sector, with more than 9,000 residents having dropped out of the workforce altogether. As a result, home prices in the province’s major centres have posted slight declines. According to the Royal LePage National House Price Composite, the aggregate price of a home in Saskatoon slipped 0.2 per cent year-over-year to $370,125, while the aggregate home price in Regina decreased slightly, falling 1.7 per cent to $323,612.
Atlantic Canada saw mixed results in the second quarter, with Fredericton posting the highest year-over-year aggregate home price appreciation at 3.8 per cent to $235,425, with Moncton close behind, rising 3.0 per cent to $193,154. Despite a rosier economic prognosis than its Atlantic neighbours, Halifax home prices remained flat year-over-year in the second quarter at $298,753. St. John’s was the only Atlantic city in the Composite to report an aggregate price decline, with the price of a home decreasing 1.5 per cent year-over-year to $336,131 amid a regional economic downturn brought on by the fall in oil prices. Meanwhile, powered by agriculture and tourism, Prince Edward Island’s economy is expected to grow slightly quicker than the national average according to most forecasters, although the residential real estate market has remained relatively flat, with the aggregate home price in Charlottetown rising 0.7 per cent year-over-year to $223,087 in the second quarter.
“Canada is not one homogeneous housing market, but rather a mosaic of many different real estate stories,” stated Soper. “While low interest rates remain the primary driver of Canada’s sustained real estate market expansion, home price trends are increasingly influenced by local factors, from the lift provided by wealthy immigrants to the drag felt by the depressed energy sector,” explained Soper. “The two regions that have provided pleasant surprises have been the oil-impacted regions where home values have been remarkably resilient. And in Quebec, where the broad-based recovery story continues, with Montreal homes experiencing healthy price increases for another consecutive quarter.”
“Southern Ontario continues to see substantial year-over-year home price appreciation, with robust sales activity and price growth in both Toronto proper and in the region’s other urban centres, with no immediate sign of slowing down,” said Soper. “It is completely fair to describe the price increases we have experienced in the Toronto market as healthy; Vancouver is a different story altogether. Canada’s most expensive market is distancing itself from the rest of the country at such a rapid rate that housing affordability has become a major public policy issue.”
“The quest for affordability in Vancouver seems to be influencing consumer housing type choices,” continued Soper. “Alongside skyrocketing prices of single-family homes, we have seen an uptick in the rate of price appreciation for condominiums over 1,000 square feet, when compared to smaller units in this market. This may indicate that families being priced out of the single-family detached home market in Vancouver are looking upwards to condominiums. In the GTA, this trend has not yet taken hold, suggesting that buyers are still predominantly moving ‘out’ to surrounding regions, versus ‘up’, in search of relatively affordable housing options,” concluded Soper.
Aggregated regions and the Royal LePage National House Price Composite (.PDF)
Canadian Housing Trends 2016 Market Survey Forecast (.PDF)
About the Royal LePage House Price Survey
The Royal LePage House Price Survey provides information on the three most common types of housing in Canada, in 53 of the nation’s largest real estate markets. Housing values in the House Price Survey are based on the Royal LePage National House Price Composite, produced quarterly through the use of company data in addition to data and analytics from its sister company, Brookfield RPS, the trusted source for residential real estate intelligence and analytics in Canada. Commentary on housing and forecast values are provided by Royal LePage residential real estate experts, based on their opinions and market knowledge.
About Royal LePage
Serving Canadians since 1913, Royal LePage is the country’s leading provider of services to real estate brokerages, with a network of over 16,500 real estate professionals in more than 600 locations nationwide. Royal LePage is the only Canadian real estate company to have its own charitable foundation, the Royal LePage Shelter Foundation, dedicated to supporting women’s and children’s shelters and educational programs aimed at ending domestic violence. Royal LePage is a Brookfield Real Estate Services Inc. company, a TSX-listed corporation trading under the symbol TSX:BRE.
For more information visit: www.royallepage.ca.
Posted on
July 8, 2016
by
Marie Taverna
Quintessentially Canadian Cottage-Life: Royal LePage finds foreign buyers account for few recreational property transactions
Retirement-bound boomers seek peaceful retreats
Toronto, ON, June 23, 2016 – Generation X buyers of cottages, cabins and chalets across Canada outnumber Baby Boomers by almost two to one, according to the Royal LePage 2016 Canadian Recreational Housing Report released today. Still, planning for retirement living is among the most common reasons potential buyers give for the purchase of a recreational property. The annual report compiles information from a cross-Canada survey of real estate advisors who specialize in recreational property sales.
The survey found that 65 per cent of advisors polled indicated that potential purchasers were considering their retirement needs in deciding to buy a recreational property, while a significant number of respondents (88 per cent) said that potential purchasers identified desired lifestyle and vacationing as their main purpose. Just under half of respondents (49 per cent) said that clients wanted a recreational property as an investment and a little over a third (37 per cent) indicated that low interest rates were a deciding factor.
The family status of the typical recreational property buyer is a couple with children, according to 76 per cent of survey respondents. When asked about the most prevalent age range of current buyers, 63 per cent of respondents identified Gen Xers (36 to 51 years old), almost double the 33 per cent who identified Baby Boomers (52 to 70 years old).
“We found it interesting that a majority of respondents identified retirement as a driving factor for a recreational property purchase consideration, but Gen Xers, still decades from retirement, were identified as the typical buyer in the current market,” said Phil Soper, president and chief executive officer, Royal LePage. “This cohort, having reached a place of stability, and often owners of primary residences in the country’s city centres, is making recreational property purchases for family enjoyment in the near-term and as a key strategy for retirement.”
“Canada’s extended low interest rate environment has clearly provided buyers with the confidence they need to invest in a cottage or cabin,” added Soper. “In contrast to urban home purchase decisions, buying a property on a lakefront or mountainside is much less about interest rates, and more about enhancing lifestyle. Cash savings trump mortgage financing when it comes to how people are acquiring recreational property.”
Foreign purchases – A relatively small proportion of transactions
Almost 95 per cent of respondents stated that foreign buyers[1] were responsible for 10 per cent or less of recreational property transactions. When asked to identify where foreign buyer activity originates from, the most common answer was North America (79 per cent), with the majority (64 per cent) of those who specified a country of origin stating purchasers were Americans.
Respondents were split on factors driving international interest between the quality of living in Canada (30 per cent), geography (27 per cent) and the low Canadian dollar (27 per cent).
“We Canadians enjoy a wonderful recreational real estate reciprocity with our American cousins. Like flocks of happy geese, we fly south in the winter, and in return, Americans head to the beautiful north country when summer arrives. Canadians have been, for years, the principal foreign buyers of sunbelt property in states like Florida and Arizona, while a lower Canadian dollar has encouraged a new wave of U.S. buyers here,” said Soper. “Whether recreational property buyers live in Canada or come from abroad, the beauty of this country, from coast-to-coast, is the appeal for families looking to ‘get away’ and enjoy the cottage experience, one that is quintessentially Canadian.”
Regional trends – Sales volumes increased year-over-year in majority of Canada’s recreational property markets
While common elements impacting the country’s regional recreational property market can be identified, variability in provincial economies and inter-provincial migration has resulted in disparate local conditions. Depressed oil prices may have dampened the recreational property activity in energy-dependent regions, and caused workers who moved for energy jobs to return to their home provinces. These provinces have seen a general uptick in demand for real estate, as the older, repatriated workers look to spend their savings on leisure properties.
Across the country, roughly two-thirds (67 per cent) of those polled said they have seen increases in sales over the past 12 months, and over half (53 per cent) expect sales activity in 2016 to exceed 2015 levels.
British Columbia saw year-over-year[2] price appreciation, and Royal LePage expects sales activity to increase throughout the remainder of the year. Advisors cited demand from retirees as a major factor driving the market.
In Alberta, sentiments were somewhat mixed, with advisors generally expecting continued softness in both price and sales activity in the coming year.
In neighbouring Saskatchewan, recreational property prices were up slightly compared to last year, with inventory and demand levels remaining stable.
Meanwhile in Manitoba, the recreational property market is recording slight softness, with inventory levels outpacing demand.
In Ontario slight increases over last year were reported in both price and sales volumes across the recreational property communities studied, with inventory levels slightly down in most markets. Looking ahead, Ontario’s recreational property markets are expected to be active for the remainder of 2016.
Similarly in Quebec, most reported that recreational property prices and activity levels have been showing slight increases this year over last, with sales volumes projected to remain healthy for the remainder of the year.
Atlantic Canada recorded that regional market conditions were mixed. Advisors in Nova Scotia reported slight year-over-year price and sales activity increases, while recreational property markets in New Brunswick remained stable on both fronts. In contrast, Newfoundland’s recreational property market reported slight decreases in prices and sales when compared to the same period last year. In light of the negative economic impacts of the oil industry’s downturn, this softness is expected to continue for the remainder of 2016, as buyers and sellers wait on the sidelines amid market uncertainty.
Average regional prices
The chart below provides average 2016 prices across Canada for six recreational property types studied in the report including lakefront, riverfront, oceanfront, island, woods cottage/cabin, and resort/condo.
View the Chart
About Royal LePage
Serving Canadians since 1913, Royal LePage is the country’s leading provider of services to real estate brokerages, with a network of over 16,000 real estate professionals in more than 600 locations nationwide. Royal LePage is the only Canadian real estate company to have its own charitable foundation, the Royal LePage Shelter Foundation, dedicated to supporting women’s and children’s shelters and educational programs aimed at ending domestic violence. Royal LePage is a Brookfield Real Estate Services Inc. company, a TSX-listed corporation trading under the symbol TSX:BRE.
Posted on
July 8, 2016
by
Marie Taverna
Home buyers remain active across Metro Vancouver
Home buyers continue to compete for homes listed for sale across the Metro Vancouver housing market.
Residential property sales in the region totalled 4,400 in June 2016, an increase of 0.6 per cent from the 4,375 sales recorded in June 2015 and a decrease of 7.7 per cent compared to May 2016 when 4,769 homes sold.
Last month’s sales were 28.1 per cent above the 10-year sales average for the month and rank as the highest selling June on record.
"While we're starting to see more properties coming onto the market in recent months, the imbalance between supply and demand continues to influence market conditions," Dan Morrison REBGV president said.
New listings for detached, attached and apartment properties in Metro Vancouver totalled 5,875 in June 2016. This represents an increase of 1.2 per cent compared to the 5,803 units listed in June 2015 and a 6.6 per cent decrease compared to May 2016 when 6,289 properties were listed.
“Since March, we’ve seen more homes listed for sale in our market than in any other four-month period this decade,” Morrison said.
The total number of properties currently listed for sale on the MLS® system in Metro Vancouver is 7,812, a 35.9 per cent decline compared to June 2015 (12,181) and a 1.1 per cent increase compared to May 2016 (7,726).
The sales-to-active listings ratio for June 2016 is 56.3 per cent. While clearly indicative of a seller’s market, this is the lowest this measure has been since February.
Generally, analysts say that downward pressure on home prices occurs when the ratio dips below the 12 per cent mark, while home prices often experience upward pressure when it reaches the 20 to 22 per cent range in a particular community for a sustained period of time.
The MLS® Home Price Index composite benchmark price for all residential properties in Metro Vancouver is currently $917,800. This represents a 32.1 per cent increase compared to June 2015.
Sales of detached properties in June 2016 reached 1,562, a decrease of 18.6 per cent from the 1,920 detached sales recorded in June 2015. The benchmark price for detached properties increased 38.7 per cent from June 2015 to $1,561,500.
Sales of apartment properties reached 2,108 in June 2016, an increase of 18.8 per cent compared to the 1,774 sales in June 2015.The benchmark price of an apartment property increased 25.3 per cent from June 2015 to $501,100.
Attached property sales in June 2016 totalled 730, an increase of 7.2 per cent compared to the 681 sales in June 2015. The benchmark price of an attached unit increased 28.1 per cent from June 2015 to $656,900.
Posted on
June 2, 2016
by
Marie Taverna
Metro Vancouver homes continue to sell at an unprecedented rate in communities across the region.
Residential property sales on the region's Multiple Listing Service® (MLS®) totalled 4,769 in May 2016, an increase of 17.6 per cent from the 4,056 sales recorded in May 2015 and a decrease of 0.3 per cent compared to April 2016 when 4,781 homes sold.
Last month’s sales were 35.3 per cent above the 10-year sales average for the month and rank as the highest sales total on record for May.
"Home sellers are becoming more active in recent months, although that activity is being outpaced by home buyer demand today," Dan Morrison, REBGV president said.
New listings for detached, attached and apartment properties in Metro Vancouver totalled 6,289 in May 2016. This represents an increase of 11.5 per cent compared to the 5,641 units listed in May 2015 and a 2.6 per cent increase compared to April 2016 when 6,127 properties were listed.
The total number of properties currently listed for sale on the MLS® system in Metro Vancouver is 7,726, a 37.3 per cent decline compared to May 2015 (12,336) and a 2.3 per cent increase compared to April 2016 (7,550).
"Economic and job growth in Metro Vancouver is out performing most regions in the country. This is helping to underpin today’s activity," Morrison said.
The sales-to-active listings ratio for May 2016 is 61.7 per cent. This is indicative of a seller’s market.
Generally, analysts say that downward pressure on home prices occurs when the ratio dips below the 12 per cent mark, while home prices often experience upward pressure when it reaches the 20 to 22 per cent range in a particular community for a sustained period of time.
The MLS® Home Price Index composite benchmark price for all residential properties in Metro Vancouver is currently $889,100. This represents a 29.7 per cent increase compared to May 2015.
Sales of detached properties in May 2016 reached 1,865, an increase of 8.2 per cent from the 1,723 detached sales recorded in May 2015. The benchmark price for detached properties increased 36.9 per cent from May 2015 to $1,513,800.
Sales of apartment properties reached 2,150 in May 2016, an increase of 34.4 per cent compared to the 1,600 sales in May 2015. The benchmark price of an apartment property increased 22.3 per cent from May 2015 to $485,000.
Attached property sales in May 2016 totalled 754, an increase of 2.9 per cent compared to the 733 sales in May 2015. The benchmark price of an attached unit increased 24.9 per cent from May 2015 to $632,400.
Information from the Greater Vancouver Real Estate Board
Posted on
May 4, 2016
by
Marie Taverna
Home sales remain at record levels across Metro Vancouver

Last month was the highest selling April on record for Metro Vancouver.*
Residential property sales in the region totalled 4,781 in April 2016, an increase of 14.4 per cent from the 4,179 sales recorded in April 2015 and a decrease of 7.6 per cent compared to March 2016 when 5,173 homes sold.
April sales were 41.7 per cent above the 10-year sales average for the month.
“Home buyer competition remains intense across the region,” Dan Morrison, REBGV president said. “Whether you’re a home buyer or seller, it’s important to work with your local Realtor to get the information you need and to develop a strategy that will help you navigate today’s market.”
New listings for detached, attached and apartment properties in Metro Vancouver totalled 6,127 in April 2016. This represents an increase of 3.9 per cent compared to the 5,897 units listed in April 2015 and a 2.4 per cent decline compared to March 2016 when 6,278 properties were listed.
"While we’re seeing more homes listed for sale in recent months, supply is still chasing this unprecedented surge of demand in our marketplace," Morrison said.
The total number of properties currently listed for sale on the MLS® system in Metro Vancouver is 7,550, a 39.3 per cent decline compared to April 2015 (12,436) and a 2.6 per cent increase compared to March 2016 (7,358).
The sales-to-active listings ratio for April 2016 is 63.3 per cent. This is indicative of a seller’s market.
Generally, analysts say that downward pressure on home prices occurs when the ratio dips below the 12 per cent mark, while home prices often experience upward pressure when it reaches the 20 to 22 per cent range in a particular community for a sustained period of time.
The MLS® Home Price Index composite benchmark price for all residential properties in Metro Vancouver is currently $844,800. This represents a 25.3 per cent increase compared to April 2015.
Sales of detached properties in April 2016 reached 1,979, an increase of 9 per cent from the 1,815 detached sales recorded in April 2015. The benchmark price for detached properties increased 30.1 per cent from April 2015 to $1,403,200.
Sales of apartment properties reached 2,107 in April 2016, an increase of 33.4 per cent compared to the 1,579 sales in April 2015.The benchmark price of an apartment property increased 20.6 per cent from April 2015 to $475,000.
Attached property sales in April 2016 totalled 695, a decrease of 11.5 per cent compared to the 785 sales in April 2015. The benchmark price of an attached unit increased 22.1 per cent from April 2015 to $608,600.
Posted on
April 13, 2016
by
Marie Taverna
The Bank of Canada announced this morning that it is maintaining its overnight rate at 0.5 per cent. In the press release accompanying the decision, the Bank noted that although first quarter GDP growth appears unexpectedly strong, it believes that strength is temporary and will likely reverse in the second quarter. However, fiscal measures announced in the March federal budget are anticipated to have a notable positive impact on growth. The Bank is now forecasting that the economy will grow 1.7 per cent this year, 2.3 per cent next year and 2 per cent in 2018. That upgrade to growth means the output gap will close sooner than expected, likely in the second half of 2017. That suggests a return to the Bank's 2 per cent target for inflation along the same time-line. Overall, the Bank judges risk in the economy as roughly balanced. Interestingly, the Bank did not highlight the housing sector as a risk despite frenzied activity in both Vancouver and Toronto.
A significantly upgraded economic forecast will very likely close the door on further discussion of an impending rate cut, though downside risks in the global economy remain. Indeed, as the economy accelerates and the output gap closes, we expect the Bank to move to a tightening bias. However, the Bank in unlikely to offset the fiscal stimulus provided by the budget and so an increase in interest rates is still some time away. If economic growth and job creation continue to surprise to the upside, it is possible that the Bank will begin raising rates in late 2017 and we could potentially see a modest rise in mortgage rates toward the end of this year in anticipation of tighter monetary policy.
“Copyright British Columbia Real Estate Association. Reprinted with permission.” BCREA makes no guarantees as to the accuracy or completeness of this information.
Posted on
April 13, 2016
by
Marie Taverna
Redistribution of Canada’s Workforce Drives Further Price Appreciation in Greater Vancouver & the Greater Toronto Area
Greater Montreal Area sees signs of a real estate market revival in the first quarter of 2016
According to the Royal LePage House Price Survey released April 7th, 2016, Canada’s residential real estate market showed strong year-over-year price increases in the first quarter of 2016. The Greater Vancouver and Greater Toronto Area (GTA) real estate markets continue to lead the country in home price appreciation, with Canada’s economic landscape supporting robust housing demand in these metropolitan areas. Additionally, an emerging trend of inter-provincial migration to British Columbia and Ontario from commodity-focused economic regions such as Alberta is expected to put further upward pressure on home prices in these areas in the coming months. Meanwhile in Quebec, the residential real estate market in the Greater Montreal Area is showing the most promising signs of renewal seen in recent years, posting home price increases and a noticeable surge in unit sales in the first quarter.
The Royal LePage National House Price Composite, compiled from proprietary property value data in 53 of the nation’s largest real estate markets, showed that the price of a home in Canada increased 7.9 per cent year-over-year to $512,621 in the first quarter of 2016. The price of a two-storey home rose 9.2 per cent year-over-year to $629,177, and the price of a bungalow increased 6.8 per cent to $426,216. During the same period, the price of a condominium increased 4.0 per cent to $344,491.
“A glance at our national house price composite points to a very strong Canadian real estate market, yet the findings contain extreme regional disparities of the kind we haven’t seen in over a decade,” said Phil Soper, president and CEO, Royal LePage. “Like an economic triumvirate, the impact of rock-bottom interest rates, the low Canadian dollar and a rapidly expanding U.S. workforce are stimulating economic growth and housing demand in our largest metropolitan areas. Conversely in cities like Calgary, the ongoing drags in depressed energy prices and worrisome employment trends have taken a material bite out of sales volumes. As a lagging indicator, home prices in Alberta and Newfoundland are just beginning to adjust to the lower demand.”
In Alberta, year-over-year home price declines have trailed the drops in sales volumes that began in 2015, but are now starting to emerge in varying degrees across the province. Calgary, with its large population of oil company head-office professionals and less affordable housing, is expected to see more of a price adjustment during the year than will be seen in Edmonton, where prices remain relatively flat. In contrast, the GTA and Greater Vancouver markets are skewed in favour of the seller, with a shortage of inventory and growing demand putting upward pressure on prices.
“Redistribution of labour across the country is further reinforcing disparities among housing markets, as the broader impacts of the oil recession on Alberta’s economy take hold. For the first time in many years, we are witnessing an out-migration trend in the province, as economic conditions and employment prospects dim,” continued Soper. “We expect British Columbia, followed by Ontario, to be the top recipients of new household inflows in the coming year, which will further fuel housing demand and price appreciation in Greater Vancouver and the GTA. This is in sharp contrast to the situation from 2011 to 2014, and in the mid 2000’s, when a booming energy sector attracted families from all over Canada to Alberta.”
The Royal LePage survey also showed a noticeable divergence between Canada’s two hottest markets: while the GTA sustained its trajectory of an aggregate year-over-year home price increase in the 8 per cent range (8.4 per cent), the Greater Vancouver market accelerated at rarely seen appreciation levels, surpassing a 20 per cent (21.6 per cent) aggregate year-over-year home price increase for the region.
During the first quarter, the Greater Montreal Area real estate market saw signs of renewal, including a dramatic increase in home sales activity, which rose 9.4 per cent year-over-year. In the luxury segment, when looking at condominiums in the $500,000 to $1-million range on the island of Montreal, the year-over-year increase in sales volume jumped to 23 per cent for the quarter and for homes over $1-million, sales volume increased 14 per cent year-over-year. With adequate supply to meet this increased demand, home prices showed moderate growth, posting a 1.8 per cent year-over-year aggregate price increase in the region.
“Following a multi-year period of stalled economic and residential real estate market growth, the Greater Montreal Area is seeing a frankly wonderful upswing in demand and unit sales, which often foreshadows stronger home price appreciation,” said Soper. “While Quebec has been slower to reap the economic benefits of more affordable energy costs in addition to the big three factors driving markets elsewhere in Canada – low interest rates, a lower dollar and expanding U.S. economy – the region is turning a corner. My vote goes to Montreal as the city most likely to exceed expectations in 2016.”
In addition to low interest rates, the low dollar, and an expanding U.S. economy, in the coming year, Montreal’s housing market is expected to gain traction as a result of strong export performance driven by a steady recovery in the manufacturing and services sectors. Large infrastructure projects such as work on the Champlain Bridge and on the Turcot Interchange are also expected to contribute to local employment, with the Conference Board of Canada projecting that these two projects alone will reverse three years of decline in Montreal’s construction sector.
“The mood is shifting in Quebec amid a renewed era of political stability and economic promise,” added Soper. “This year we expect to see improved business and consumer confidence in the province, which will result in stronger demand for larger purchases such as houses. Home buyers are well positioned as housing is much more affordable than in other large business centres such as Vancouver and Toronto.”
Outside of British Columbia and Ontario, year-over-year changes in house prices were generally modest in the first quarter. In Atlantic Canada, Moncton saw the largest gains, posting an aggregate home price increase of 3.4 per cent, while the remainder of the Atlantic regions surveyed saw slight to moderate declines. In other parts of Western Canada, Winnipeg home prices increased 3.8 per cent year-over-year, while Regina and Saskatoon, feeling some of the impact of declines in commodity prices and net-migration, saw slight decreases of 1.1 per cent and 0.3 per cent, respectively.
“The economic miracle that is contemporary Canada is driven in significant measure by our success at attracting quality immigrants to our land. While this is not new news, the possibility of a Donald Trump presidency has put renewed global focus on the often stark differences in opportunity and attitude that exist on either side of our huge border. In what started as a media prank, Canada’s attractiveness as a more realistic place to pursue life, liberty and happiness is gaining traction even in America. While we may just be a curiosity for many in the United States, the Cape Breton advertising campaign urging Americans to move north, as well as the record number of Americans googling ‘how to move to Canada’ reinforces the worldwide strength of brand-Canada as a prosperous and tolerant place to raise a family,” concluded Soper.
Home prices in Greater Vancouver continued to see significant appreciation during the first quarter of 2016, with the aggregate price of a home rising 21.6 per cent year-over-year to $1,044,750. The median price for bungalows in Greater Vancouver surged 25.7 per cent year-over-year to $1,116,136, while two-storey homes climbed 23.6 per cent to $1,418,231. Condominiums also saw notable growth during the quarter, increasing 9.5 per cent to $487,300.
Posted on
April 4, 2016
by
Marie Taverna
Spring is often the time for out with the old and in with the new. So it must be "garage sale time." Whether you are planning to move or just want to clean up or de-clutter, Spring is often the time homeowners start planning a yard or garage sale. Below are some tips to get you started.
Planning a Garage Sale
Rather than discarding what you many no longer need or want, try selling it at a garage sale. A garage sale can be a profitable and fun way to make sure items are reused.
The following are some tried and true tips for a successful sale:
1. Pick the date
Make sure that the date will not conflict with holidays or special events that compete for attendance. Weekends are more successful than weekdays.
2. Bigger is better
Check with friends, relatives and neighbours to see if they would like to join you or if they have anything for you to sell on their behalf. More people mean less work and more items means more shoppers. Sharing on advertising costs increases your profit margin, too.
3. Get good sellers
Appliances, furniture, toys, tool, dishes and other such practical household items are popular. Records are also a good seller. Clothing does not usually have a high resale value, although kids clothing is the exception. Arrange kids clothing by size, and label each item. Clean everything. Make sure your items are working. If not, label them as such. For specialty items, include important information on labels. If you have items that you do not think will sell, have a “free box”. You’d be surprised what people will take and find uses for. If you have a truck, consider offering free delivery for big items within a certain distance – Customer service sells.
4. Promote your sale
If you have a community paper that is delivered to every household in your area, advertise in the classified section. Otherwise, advertise in the newspaper read most often by people in your area. Include the date, time (start early as most sales end by 1 or 2 p.m.), address and list some of the more desirable and unique items. If you don’t want early birds, include that in your ad but expect them anyway. If you are hosting the sale with others, split the advertising cost and remember to advertise the number of households participating in the sale.
5. Signage is key
Make sure the signs you make are large, clear and if possible, waterproof. Use well made, creative signs because they will attract more buyers. Some newspapers provide garage sale kits if you advertise with them, which usually includes a few signs. You should have enough signs to place at the intersection closest to your house, in front of your house and on the main streets near your house. Always include the date, time, and address on the signs.
Make signs for goods displayed at your sale. For example, “House wares”, “Kids Clothes”, etc. Make a sign that reads “Reduced Prices”. You can post this halfway through your sale.
6. Rainy day plan
Have a contingency plan for wet weather. Consider putting up tarps or holding your sale under cover.
7. Set fair prices
If you are not sure how to price your items, visit a local thrift store or garage sales. Don’t price your items too low initially, because people will bargain with you.
Put prices on everything using masking tape or removable stickers. This saves you from inventing prices on the spot and eliminates the need for everyone to ask you for prices. If many people are selling their goods, use different coloured tags (or different coloured dots on masking tape) and record sales by colour so you can correctly divide the money at the end of the day. Have lots of change and small bills on hand.
8. Make it social
Invite friends or neighbours the night before for a preview sale. If you have a street sale with your neighbours, have a BBQ afterward. At your sale, sell donuts and coffee. This will encourage people to stay longer, socialize and have a better opportunity to look at your wares.
9. It’s sale day
Expect early birds. Clear all paths and move any cars out of the driveway. Set up some tables the night before and carry them out first thing in the morning. Display your goods in an attractive way on tables, boxes or even the front lawn. For example, reuse coloured cardboard to display jewellery, and then attach the cardboard to a bulletin board. Group similar items together. If you are selling clothes, place them on hangers to display on the fence or a coat rack. Have an electrical outlet or extension cord accessible if you are selling electronic items. This enables potential buyer to test the items before they buy. Cover any items you do not want to sell with old sheets or move them out of sight. This helps prevent potential theft and stops people from trying to buy your lawnmower or garden tools.
Offer laundry hampers as shopping baskets. This allows shoppers the luxury of browsing without dropping their armful of goodies. Have extra shopping bags and boxes available for shoppers who purchase numerous items. Keep the money with you at all times. Use an apron with pockets or have one person dedicated to handling the cash. Remember to lock your house.
Be flexible and accept reasonable offers. Consider throwing in related token items, and post the “Reduced Prices” sign at lunchtime.
10. Clean up time
At the end of your sale, take down all signs and posters. If you have useful items remaining, donate them to charity or try selling them at a local flea market.
Posted on
April 4, 2016
by
Marie Taverna
Metro Vancouver home sales eclipsed 5,000 in March for the first time on record.
Residential property sales in the region totalled 5,173 in March 2016, an increase of 27.4 per cent from the 4,060 sales recorded in March 2015 and an increase of 24 per cent compared to February 2016 when 4,172 homes sold.
Last month’s sales were 56 per cent above the 10-year sales average for the month.
"March was the highest selling month the REBGV has ever recorded,” REBGV president said. “Today's demand is broad based. Home buyers are active in neighbourhoods across our region."
New listings for detached, attached and apartment properties in Metro Vancouver totalled 6,278 in March 2016. This represents an increase of 5.2 per cent compared to the 5,968 units listed in March 2015 and an 8 per cent increase compared to February 2016 when 5,812 properties were listed.
The total number of properties currently listed for sale on the MLS® system in Metro Vancouver is 7,358, a 40.5 per cent decline compared to March 2015 (12,376) and a 0.8 per cent increase compared to February 2016 (7,299).
“Strong job and economic growth in our province, positive net migration and low interest rates are helping to drive this activity," said.
The MLS® Home Price Index composite benchmark price for all residential properties in Metro Vancouver is currently $815,000. This represents a 23.2 per cent increase compared to March 2015.
Sales of detached properties in March 2016 reached 2,135, an increase of 24.8 per cent from the 1,711 detached sales recorded in March 2015. The benchmark price for detached properties increased 27.4 per cent from March 2015 to $1,342,500.
Sales of apartment properties reached 2,252 in March 2016, an increase of 38.4 per cent compared to the 1,627 sales in March 2015.The benchmark price of an apartment property increased 18.8 per cent from March 2015 to $462,800.
Attached property sales in March 2016 totalled 786, an increase of 8.9 per cent compared to the 722 sales in March 2015. The benchmark price of an attached unit increased 20.1 per cent from March 2015 to $589,100.
Posted on
February 1, 2016
by
Marie Taverna
Home buyer activity remains at near record levels across the Metro Vancouver housing market.
Residential property sales in Greater Vancouver totalled 2,519 in January 2016, an increase of 31.7 per cent from the 1,913 sales recorded in January 2015 and a 10.9 per cent decline compared to December 2015 when 2,827 home sales occurred.
Last month’s sales were 46 per cent above the 10-year sales average for the month and rank as the second highest January on record.
“Fundamental economics are driving today’s market. Home buyer demand is at near record heights and home seller supply is as low as we’ve seen in many years,” Darcy McLeod, REBGV president said.
New listings for detached, attached and apartment properties in Greater Vancouver totalled 4,442 in January 2016. This represents a 6.2 per cent decline compared to the 4,737 units listed in January 2015 and a 119.8 per cent increase compared to December 2015 when 2,021 properties were listed.
“The MLS® is the most powerful real estate marketing system in the country. If you’re thinking of selling, it’s important to talk with your REALTOR® about putting your home on the MLS® system to ensure your property gets maximum exposure,” McLeod said.
The total number of properties currently listed for sale on the MLS® system in Metro Vancouver is 6,635, a 38.6 per cent decline compared to January 2015 (10,811) and a 10.1 per cent increase compared to December 2015 (6,024).
The sales-to-active listings ratio for January 2016 is 38 per cent. This is indicative of a seller’s market.
Generally, analysts say that downward pressure on home prices occurs when the ratio dips below the 12 per cent mark, while home prices often experience upward pressure when it reaches the 20 to 22 per cent range in a particular community for a sustained period of time.
Sales of detached properties in January 2016 reached 1,047, an increase of 34.1 per cent from the 781 detached sales recorded in January 2015. The benchmark price for detached properties increased 27.9 per cent from January 2015 to $1,293,700.
Sales of apartment properties reached 1,096 in January 2016, an increase of 35.5 per cent compared to the 809 sales in January 2015.The benchmark price of an apartment property increased 19.4 per cent from January 2015 to $456,600.
Attached property sales in January 2016 totalled 376, an increase of 16.4 per cent compared to the 323 sales in January 2015. The benchmark price of an attached unit increased 16.4 per cent from January 2015 to $563,700.
To find out what is happening in your neighbourhood, please feel free to call us.
Posted on
January 4, 2016
by
Marie Taverna

Metro Vancouver home sales set an all-time record in 2015
In a year when the number of homes listed for sale was below historical averages, actual home sales in Metro Vancouver set a new record.
The Real Estate Board of Greater Vancouver (REBGV) reports that 2015 home sales were the highest annual total in REBGV history. This was powered early in the year by four straight months with more than 4,000 sales a month from March to June, another first for REBGV.
Sales of detached, attached and apartment properties in 2015 reached 42,326, a 27.8 per cent increase from the 33,116 sales recorded in 2014, and a 48.4 per cent increase over the 28,524 residential sales in 2013.
The total number of homes listed for sale on the MLS® in 2015 ranked fifth in the last ten years, while the MLS® Home Price Index (HPI) saw double-digit year-over-year price increases.
The number of residential properties listed for sale on the Multiple Listing Service® (MLS®) in Metro Vancouver in 2015 reached 57,249. This is an increase of 2.1 per cent compared to the 56,066 properties listed in 2014 and an increase of 4.6 per cent compared to the 54,742 properties listed in 2013.
With sales-to-active-listings ratios above 25 per cent for 11 months in 2015, the Metro Vancouver market experienced seller’s market conditions for much of the year.
"Home buyers were active and motivated throughout 2015 despite the pressure on supply of homes on the market," Darcy McLeod, REBGV president said. "Housing markets typically experience quieter periods within a calendar year, but that wasn't the case in Metro Vancouver last year."
The MLS® Home Price Index composite benchmark price for all residential properties in Metro Vancouver ends the year at $760,900. This represents an 18.9 per cent increase compared to December 2014.
“We often hear economists say that seller’s market conditions put upward pressure on home prices,” McLeod said. “That was certainly the case in 2015, with price increases ranging from 14 to 24 per cent depending on property type.”
December summary
Residential property sales in Greater Vancouver totalled 2,827 in December 2015, an increase of 33.6 per cent from the 2,116 sales recorded in December 2014 and a 19.8 per cent decline compared to November 2015 when 3,524 home sales occurred.
New listings for detached, attached and apartment properties in Greater Vancouver totalled 2,021 in December 2015. This represents a 7 per cent increase compared to the 1,888 units listed in December 2014 and a 40.4 per cent decline compared to November 2015 when 3,392 properties were listed.
The total number of properties currently listed for sale on the MLS® system in Metro Vancouver is 6,024, a 41.6 per cent decline compared to December 2014 and a 25.6 per cent decrease compared to November 2015.
Sales of detached properties in December 2015 reached 1,136, an increase of 36.4 per cent from the 833 detached sales recorded in December 2014. The benchmark price for detached properties increased 24.3 per cent from December 2014 to $1,248,600.
Sales of apartment properties reached 1,225 in December 2015, an increase of 34.3 per cent compared to the 912 sales in December 2014.The benchmark price of an apartment property increased 14 per cent from December 2014 to $436,200.
Attached property sales in December 2015 totalled 466, an increase of 25.6 per cent compared to the 371 sales in December 2014. The benchmark price of an attached unit increased 13.6 per cent from December 2014 to $543,700.
Posted on
January 4, 2016
by
Marie Taverna
  Residential fires take their toll every day, every year, in lost lives, injuries, and destroyed property. According to the National Fire Protection Association, a home structure fire was reported every 86 seconds in the U.S. in 2014. The fact is that many conditions that cause house fires can be avoided or prevented by homeowners. Taking the time for some simple precautions, preventive inspections, and concrete planning can help prevent fire in the home - and can save property and lives should disaster strike. Residential fires take their toll every day, every year, in lost lives, injuries, and destroyed property. According to the National Fire Protection Association, a home structure fire was reported every 86 seconds in the U.S. in 2014. The fact is that many conditions that cause house fires can be avoided or prevented by homeowners. Taking the time for some simple precautions, preventive inspections, and concrete planning can help prevent fire in the home - and can save property and lives should disaster strike.
- All electrical devices including lamps, appliances, and electronics should be checked for frayed cords, loose or broken plugs, and exposed wiring. Never run electrical wires, including extension cords, under carpet or rugs as this creates a fire hazard.
- Fireplaces should be checked by a professional chimney sweep each year and cleaned if necessary to prevent a dangerous buildup of creosote, which can cause a flash fire in the chimney. Cracks in masonry chimneys should be repaired, and spark arresters inspected to ensure they are in good condition and free of debris.
- When using space heaters, keep them away from beds and bedding, curtains, papers - anything flammable. Always follow the manufacturer's instructions for use. Space heaters should not be left unattended or where a child or pet could knock them over.
- Use smoke detectors with fresh batteries unless they are hard-wired to your home's electrical system. Smoke detectors should be installed high on walls or on ceilings on every level of the home, inside each bedroom, and outside every sleeping area. Statistics show that nearly 60% of home fire fatalities occur in homes without working smoke alarms. Most municipalities now require the use of working smoke detectors in both single and multi-family residences.
- Children should not have access to or be allowed to play with matches, lighters, or candles. Flammable materials such as gasoline, kerosene, or propane should always be stored outside of and away from the house.
- Kitchen fires know no season. Grease spills, items left unattended on the stove or in the oven, and food left in toasters or toaster ovens can catch fire quickly. Don't wear loose fitting clothing, especially with long sleeves, around the stove. Handles of pots and pans should be turned away from the front of the stove to prevent accidental contact. Keep an all-purpose fire extinguisher within easy reach. Extinguishers specifically formulated for grease and cooking fuel fires are available and can supplement an all-purpose extinguisher.
- Have an escape plan. This is one of the most important measures to prevent death in a fire. Visit ready.gov for detailed information on how to make a plan. Local fire departments can also provide recommendations on escape planning and preparedness. In addition, all family members should know how to dial 911 in case of a fire or other emergency.
- Candles add a cosy feeling, and should be placed in stable holders and located away from curtains, drafts, pets, and children. Never leave candles unattended, even for a short time.
Your local Pillar To Post office wishes you and your clients a happy and safe winter.
Jim Vestad
Registered Home Inspector
Posted on
October 10, 2015
by
Marie Taverna
Conditions continue to favour home sellers across *Metro Vancouver’s housing market.
The Real Estate Board of Greater Vancouver (REBGV) reports that residential property sales in Metro Vancouver reached 3,345 on the Multiple Listing Service® (MLS®) in September 2015. This represents a 14.5 per cent increase compared to the 2,922 sales recorded in September 2014, and a 0.5 per cent decrease compared to the 3,362 sales in August 2015.
Last month’s sales were 32.9 per cent above the 10-year sales average for the month.
“Residential home sales have been trending at 25 to 30 per cent above the ten-year sales average for most of the year. The number of homes listed for sale hasn’t been keeping up with the demand,” Darcy McLeod, REBGV president said. “It’s this dynamic that’s placing upward pressure on home prices, particularly in the detached home market.”
New listings for detached, attached and apartment properties in Metro Vancouver totalled 4,846 in September. This represents a 7.9 per cent decline compared to the 5,259 new listings reported in September 2014.
The total number of properties listed for sale on the real estate board’s MLS® is 10,805, a 27 per cent decline compared to September 2014 and a 0.8 per cent decline compared to August 2015.
“At no point this year has the number of homes listed for sale exceeded 14,000, which is the first time this has occurred in the region since 2007,” McLeod said.
The MLS® Home Price Index composite benchmark price for all residential properties in Metro Vancouver is currently $722,300. This represents a 13.7 per cent increase compared to September 2014.
The sales-to-active-listings ratio in September was 31 per cent. Generally, analysts say that downward pressure on home prices occurs when the ratio declines below the 12 per cent mark, while home prices often experience upward pressure when it reaches 20 per cent, or higher, in a particular community for a sustained period of time.
Sales of detached properties in September 2015 reached 1,272, an increase of 0.2 per cent from the 1,270 detached sales recorded in September 2014, and a 24.3 per cent increase from the 1,023 units sold in September 2014. The benchmark price for a detached property in Metro Vancouver increased 18.9 per cent from September 2014 to $1,179,700.
Sales of apartment properties reached 1,529 in September 2015, an increase of 28.7 per cent compared to the 1,188 sales in September 2014, and an increase of 50.2 per cent compared to the 1,018 sales in September 2013. The benchmark price of an apartment property increased nine per cent from September 2014 to $415,100.
Attached property sales in September 2015 totalled 544, an increase of 17.2 per cent compared to the 464 sales in September 2014, and a 23.1 per cent increase from the 442 attached properties sold in September 2013. The benchmark price of an attached unit increased 8.1 per cent between September 2014 and 2015 to $518,600.
*Editor’s Note: Areas covered by Real Estate Board of Greater Vancouver include: Whistler, Sunshine Coast, Squamish, West Vancouver, North Vancouver, Vancouver, Burnaby, New Westminster, Richmond, Port Moody, Port Coquitlam, Coquitlam, New Westminster, Pitt Meadows, Maple Ridge, and South Delta.
Posted on
September 20, 2015
by
Marie Taverna
Welcome to 14-2736 Atlin Place at Cedar Green Estate. This lovely 2 bedroom townhome is sparkling clean & freshly painted top to bottom. Being an end unit with lots of windows, this lets the natural light flow in. Neutral coloured laminate flooring will match any decor. Cute kitchen with eating bar, perfect for your morning latte. Wood burning fireplace for that warmth in the winter. Bay window in living room. Nook in the living room is perfect for a small home office. Master bedroom has large walk in closet with attic storage. Bonus outside storage room for all you seasonal items. Bright 4 piece bathroom up stairs. Upstairs laundry. Why buy a condo when you can have a townhome...Call for more details.
http://www.royallepagemc.ca/15/22515/599857/
Posted on
September 20, 2015
by
Marie Taverna
Welcome to "The Maples." This 55+ town home complex is perfect for Baby Boomers, looking to down size. This lovely town home has the master bedroom on the main level and two bedrooms upstairs. Very elegant living room with gas fireplace. Living room and dining room with lovely laminate flooring and high ceilings. The kitchen has white cabinets and appliances and has been updated with quartz counter tops. Eating area or family room you decide.
Open loft is perfect for watching TV on your flat screen. The skylight lets extra light flow through. 4 piece bath on main and a 3 piece for your guests upstairs. Walk out to your fully fenced sunny south facing backyard and patio. Laundry room with stacker washer and dryer, even space for a small freezer or fridge. Storage locker in the carport for your extra storage. Quiet location. 2 parking spots. Call for more details...
http://www.royallepagemc.ca/15/22515/599854/
Posted on
September 19, 2015
by
Marie Taverna
Absolutely stunning 2 bedroom & den condo unit. Literally updated from the top to the bottom. From the moment you walk in, your breath will be taken away. The living room is large & inviting with gas fireplace with custom mantel. Slider glass door leads to balcony for BBQ. The den can be made into 3rd bedroom, if needed or it makes a great open office space. The kitchen has been updated with dark wood cabinets & fresh white appliances. Drawers with slow close feature. Lots cabinets for your kitchen knick/knacks. Both bedrooms are a good size for your bedroom furniture. Both bathrooms have been updated very tastefully. Deluxe stacker washer & dryer. Popcorn ceiling removed for flat ceilings. Updated lighting throughout. Concrete, laminate & tile flooring throughout for easy care. Lovely choice of paint colours. Minutes away from Lougheed Mall, Skytrain, Lougheed Highway & the Freeway. The home is a pleasure to show. You will be very impressed...
http://www.royallepagemc.ca/15/22515/604983/
Posted on
September 19, 2015
by
Marie Taverna
Welcome to "The Jefferson," in Coquitlam. This absolutely stunning newly renovated condo, is ready to move into. From the moment you walk in you are home. Lovely living room with gas fireplace. Bright kitchen with shaker white cabinets and Quartz counters tops, Newer S/S Appliances. Eating area nook. New carpeting and tile flooring throughout. Large Master Bedroom. Some updates in the bathrooms. New Washer/Dryer. Freshly Painted. Sunny balcony. Central location and minutes to future Evergreen Line, swimming pool, Town Centre Park and much more... Call for more information.
http://www.royallepagemc.ca/15/22515/602499/
|
 Subscribe with RSS Reader
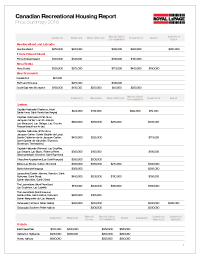



 The data relating to real estate on this website comes in part from the MLS® Reciprocity program of either the Greater Vancouver REALTORS® (GVR), the Fraser Valley Real Estate Board (FVREB) or the Chilliwack and District Real Estate Board (CADREB). Real estate listings held by participating real estate firms are marked with the MLS® logo and detailed information about the listing includes the name of the listing agent. This representation is based in whole or part on data generated by either the GVR, the FVREB or the CADREB which assumes no responsibility for its accuracy. The materials contained on this page may not be reproduced without the express written consent of either the GVR, the FVREB or the CADREB.